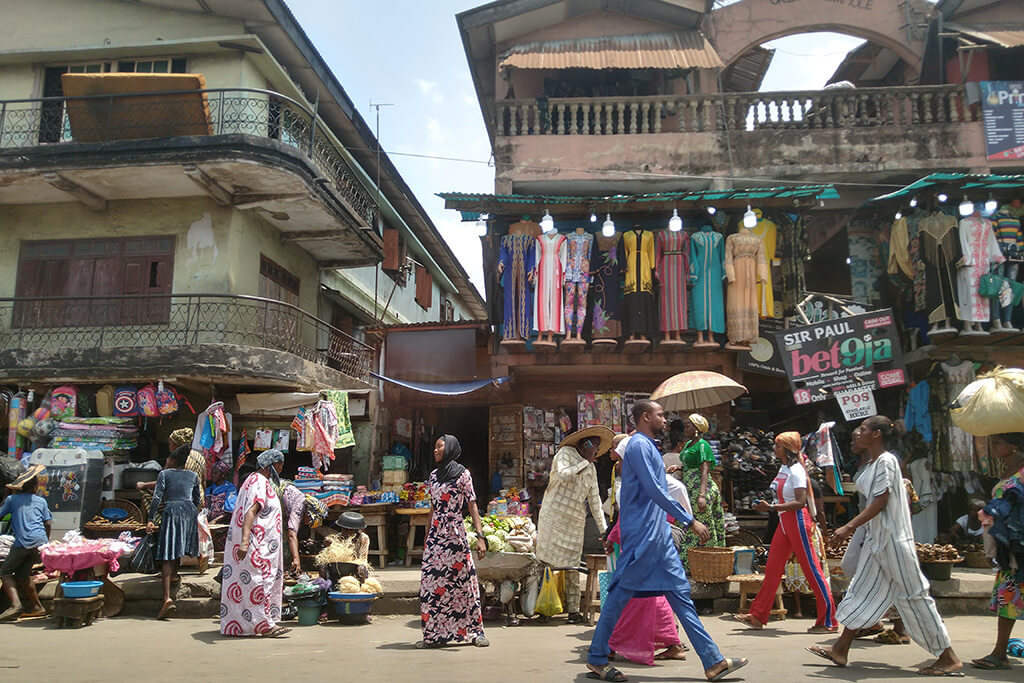
Transport in major metropolitan areas often reinforces existing gender inequalities. While one mode of sustainable transport, such as cycling, might be ideal for men, women might be reluctant to take it up for safety reasons. A Bus Rapid Transit (BRT) route might be efficient and affordable for a man commuting between home and work but deemed too expensive or time-consuming for a woman tasked with caregiving errands.
Understanding how people use transport is key to reducing inequities. Yet if the data used to formulate evidence-based transport policy does not assess the needs of all users, regardless of gender, income, age, or ability, there’s a risk that these inequities may be exacerbated. To rebalance sustainable mobility, making it safe, affordable, and comfortable for everyone, city mobility planners and policy makers need gender segregated data to draw on. You cannot resolve obstacles until you’re aware they exist.
Recognizing the need for more inclusive data, the Women Mobilize Women initiative by TUMI commissioned two studies that collected and analyzed such data in cities across Africa. “Decoding women’s transport experiences,” from WhereIsMyTransport looked at the individual experiences of women using public transport in Nairobi, Lagos, and Gauteng. Meanwhile, in Lagos, Nigeria and Abidjan, Côte d’Ivoire, Groots Consulting gathered data from across the spectrum in order to delineate differences between the genders.*
Best Practices for Data Collection
While each of the cities in the studies face structural inequities such as economic disparity that feed into transport inequities, the differences in infrastructure and population require a more nuanced look at how mobility is used in order to make sustainable options more attractive. To tease out those nuances, the two studies tested out new and innovative data collection techniques that could be viewed as best practices for gaining greater insight into the gender gap in mobility, capturing the reality for many on the ground.
Surveying at the Local Shops
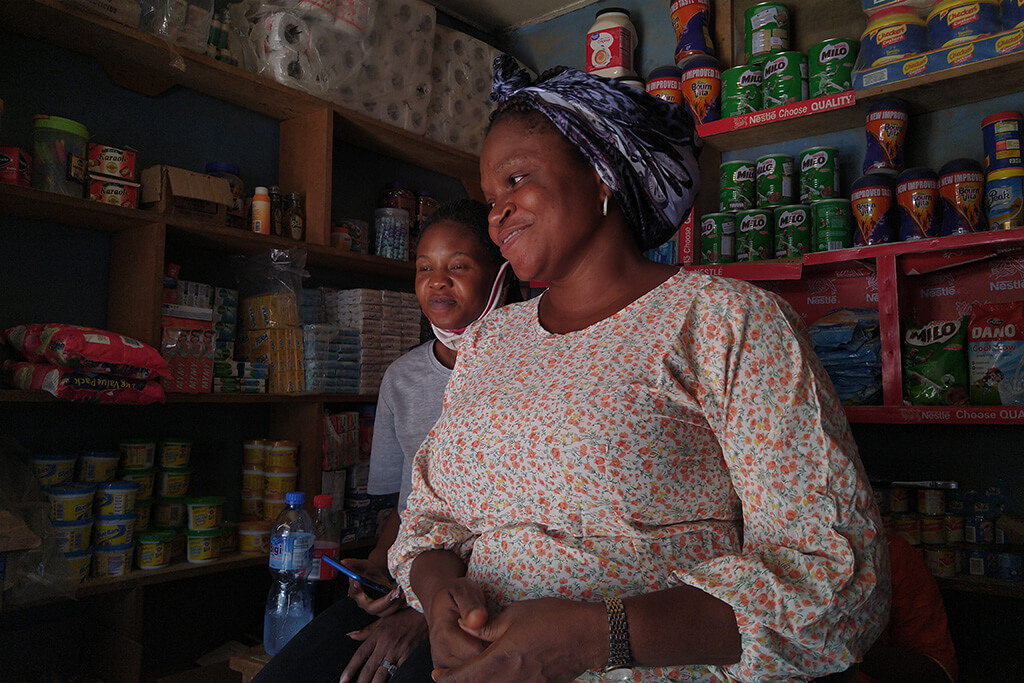
In Lagos and Abidjan, Groots researchers took a community-level approach. Taking advantage of existing resources, the team leveraged the trust and familiarity local residents have in convenience stores in neighborhood centers, places frequented by both users and non-users of public transport. After formulating a digitally accessible questionnaire, the team offered incentives to shopkeepers to gather a number of survey responses within a short timeframe. The survey, which was rolled out across the “tabtap” SHOP app, gathered over 1,000 valid responses with over 32,000 individual data points, including insights into transport satisfaction. This approach worked especially well for several reasons:
- Those who may not otherwise participate in such surveys due to their digital literacy could take part with the help of shopkeepers in completing the survey.
- The use of shops adjacent to public transport stops or hubs could accurately capture the lived experience of a range of public transport users.
- Potential biases were eliminated as interviewers were not present.
Controlling for location, types of shops, and time of day, the data collection could be viewed as random and representative. The results also showed a good balance between male and female respondents in both cities and revealed other regional differences that might otherwise have gone unremarked. Women in Abidjan, for example, communicated reluctance to use bicycles as an alternative mode of transport — something not found in Lagos.
While the data analysis revealed location-specific clues as to how to better promote sustainable mobility (in Lagos, for example, less than one-quarter of women respondents said they could afford to use public transport each week at its current prices), this sort of randomized survey offers future benefits. Now that these shops have actively taken part in such a survey, the data collection process can be more readily be reactivated to assist in future data collection. The platform, which has already proved itself efficient, flexible, and highly scalable, can be turned to again to observe trends, developments, or identify any impacts due to infrastructure changes.


